
Ozone Depleting Substances
Header Image: Measurements of chlorine within the Antarctic ozone hole from NASA’s Aura satellite.
The Antarctic ozone hole is a dramatic demonstration of the environmental impact caused by emissions of CFCs, HCFCs and other ozone depleting substances (ODS) that release chlorine and bromine as they break down in the stratosphere.
In addition, ODS emissions have made a significant contribution to climate change over the past 50 years due to the fact they are potent greenhouse gases that cause the atmosphere to trap heat. They do this by altering the balance of solar radiation reaching the Earth’s surface and infrared radiation emitted from Earth back into space.
Demonstrating the global progress made since the Montreal Protocol was signed in 1987, atmospheric scientists from the NASA Goddard Space Flight Center recently reported the first observation of declining chlorine levels from CFC emissions in the Antarctic ozone hole.
Measurements of stratospheric chlorine and ozone made by NASA’s Aura satellite revealed that 20 per cent less ozone was depleted during the Antarctic winter of 2016 than in 2005.
This recovery of the ozone layer is a direct result of worldwide action to phase out of CFCs under the Montreal Protocol. It means the ozone hole will diminish over the coming decades, reducing harmful UV radiation.
Phasing out the manufacture and use of ODS under the Montreal Protocol has also avoided significant greenhouse gas emissions. In Australia alone, the decrease in CFC emissions between 1995 and 2015 offset 55 per cent of the nation’s reported net greenhouse gas emissions in the same timeframe.
The chart below displays the decline in Australian ODS imports and manufacture.

Australian imports (tonnes) of ODSs).
Globally, the slowing of ODS emissions between 2008 and 2012 resulted in greenhouse gas reductions up to six times greater than the Kyoto Protocol target for the same timeframe.
The chart below displays global and Australian reductions in CO2-equivalent emissions of ODS.
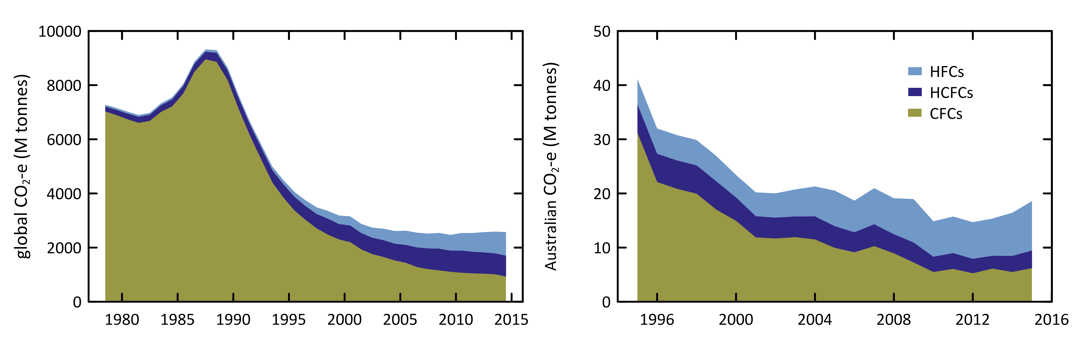
Global (since 1978) and Australian (since 1995) CFC, HCFC and HFC emissions (M tonne CO2-e).
Much of the credit for these environmental improvements must go to the diligence of those working in the refrigeration and air conditioning industry. Their efforts to bring about equipment and installation improvements, reduced leakage rates and the recovery and destruction of contaminated and unwanted refrigerants have resulted in a substantial positive impact.
What is in the air
The CSIRO Cape Grim facility in Tasmania measures the world’s most comprehensive list of ozone depleting substances.
For two consecutive measurement periods, 2014-2015 and 2015-2016, emissions of R12 declined by 11 k tonnes, the fastest rate since 2005 when emissions dropped 14 k tonnes.
Until 2014, R12 had been the dominant CFC but declining R12 emissions compared with much slower decreases in R11 emissions have resulted in R11 becoming the most prevalent CFC.
In 2016, Cape Grim results showed atmospheric levels of most CFCs had either stabilised or are in decline, except for slow increases in levels of R13 and R115.

CSIRO/BOM Cape Grim Atmospheric Research Station
Total CFCs in the background atmosphere and chlorine from CFCs both declined by 0.5 per cent between 2015 and 2016.

Total chlorine from CFCs, HCFCs, CTC: CCl4, MC: CH3CCl3 and other chlorine-containing ODSs as measured at Cape Grim.
However, ongoing Australian emissions of CFCs have grown 7.0 per cent per year since 1996, as measured at Cape Grim, and increased 12 per cent between 2014 and 2016.
These emissions are thought to be from older equipment and materials still in use (such as refrigerators, aerosol cans and fire extinguishers) or leaking from landfills containing these types of buried equipment and materials.

Global annual CFC emissions (M tonnes) 1980-2015
Cape Grim data showed growth in atmospheric levels of all the major HCFCs in 2016 (R22, R141b and R142b), although these increased at a slower rate than 2015 and overall HCFC growth is slowing, while levels of minor HCFCs (such as R124, R132b and R225ca) declined slowly.
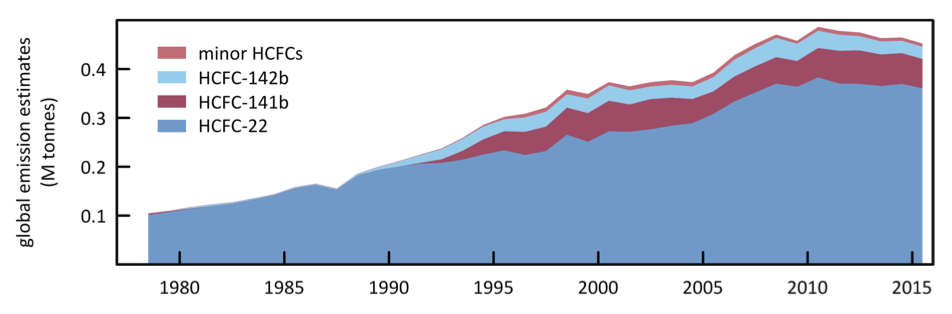
Global annual HCFC emissions (M tonnes) 1980-2015
The dominant HCFC, R22, accounts for 83 per cent of atmospheric abundance and 90 per cent of the growth of all HCFCs. Higher levels of R22 in the atmosphere meant total HCFC levels and those of chlorine from HCFCs both increased by 1.4 per cent in the period 2015-2016.
Overall Australian R22 emissions declined on average 3.0 per cent per year between 1999 and 2015.